One of the areas of research in which I'm involved has to do with the sensing and measurement of artificial light in the night sky, a phenomenon known as "skyglow". Skyglow competes with starlight, obscuring our views of the heavens. It's also a source of harmful light in the nighttime environment associated with a host of ecological harms.
Motivation
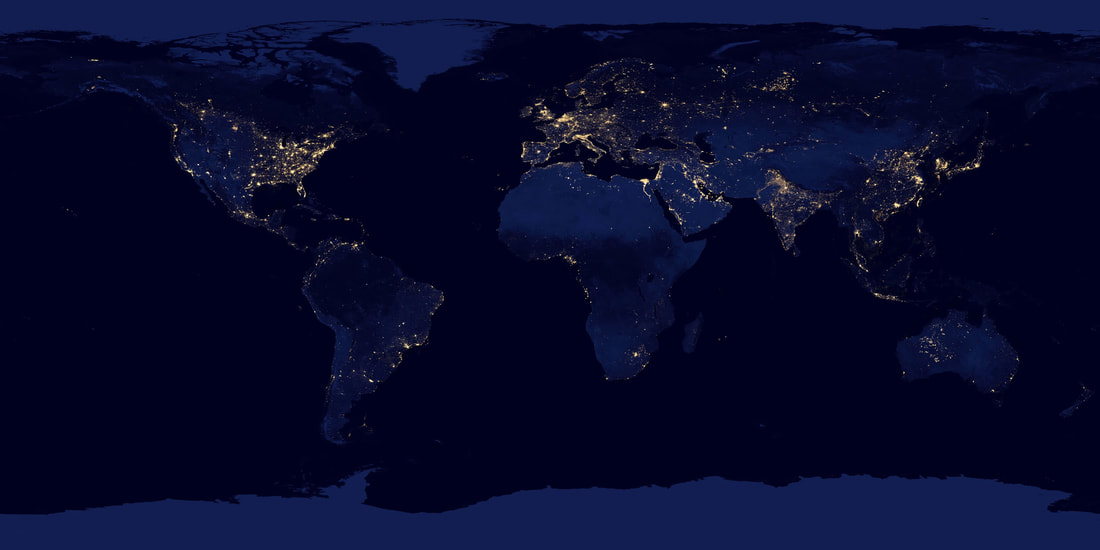
Light pollution is a novel environmental threat, emerging in only about the last 130 years since the introduction of electric lighting to outdoor spaces. In the 2010s, taken as a global average, the world became 2% brighter each year, a rate about double that of population growth. The world at night now shines brightly, as seen in the NASA global composite image below.
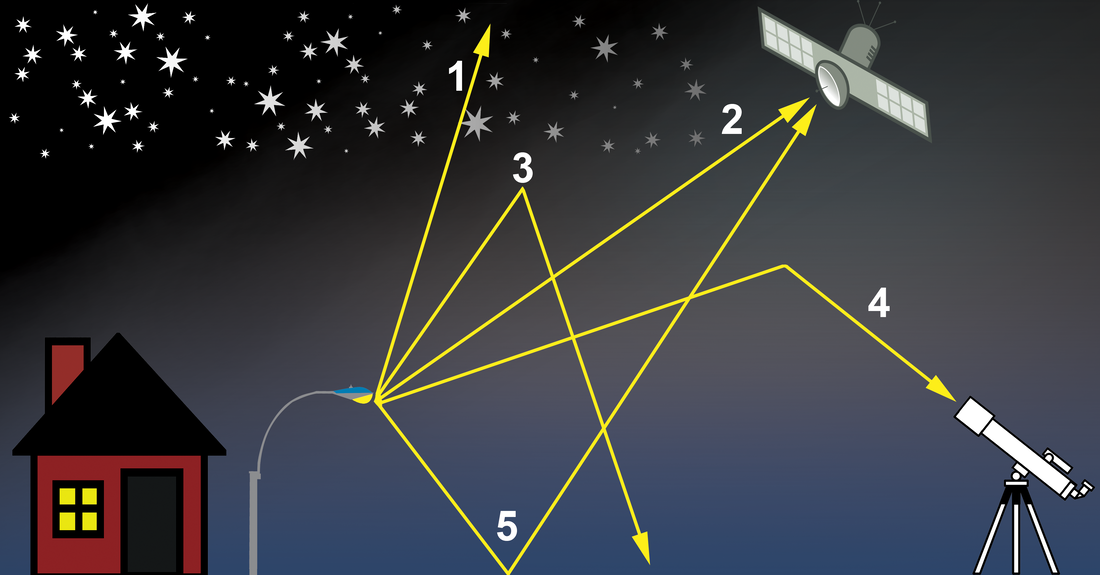
The light in the image originates on the ground, mainly in cities, and is directed to the night sky. Orbiting satellites see the fraction of this light that travels completely through the atmosphere, but not all light reaches that far. Some fraction of it is scattered by the atmosphere back toward the ground, where it is perceived as skyglow. In the following diagram, rays of light emerging from a street light take many different paths, some of which contributes to skyglow.
The streetlight emits light in many different directions. Some of the light rays (“1″) are directed up into the sky and travel completely through Earth’s atmosphere. Of these rays, a few (“2″) will be detected by satellites as they pass over the nighttime side of our planet, producing images like the one above. In still other cases (“3”), rays are scattered back to the ground by dust particles or molecules in the atmosphere, forming skyglow. Occasionally, rays directed downward (“4”) reflect off the ground into the sky, where they might escape the atmosphere and be detected by satellites. Lastly, some downward-scattered rays (“5”) make it into astronomers’ telescopes, effectively blocking their view of the universe.
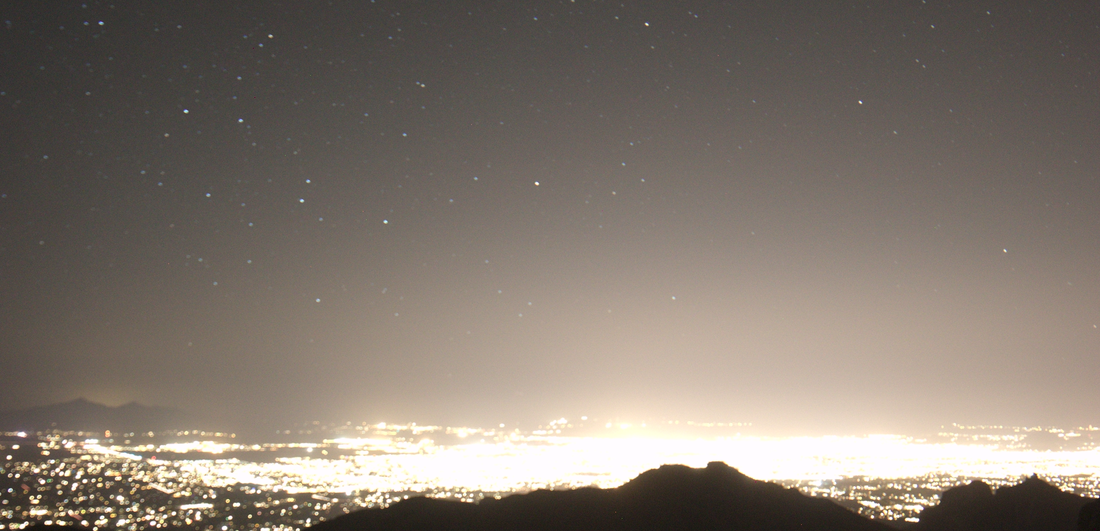
Skyglow is illustrated below in an image of the lights of Tucson taken from Windy Point in the Santa Catalina Mountains north of the city on the night of 28 May 2017.
Skyglow is illustrated below in an image of the lights of Tucson taken from Windy Point in the Santa Catalina Mountains north of the city on the night of 28 May 2017.
Given that the Tucson area hosts one of the largest assemblages of astronomical observatories in the world, and that astronomy and space science contribute over a quarter-billion dollars a year to the Arizona economy, there is good reason to try to keep the night skies in the region as dark as possible despite the presence of a major urban center. The City of Tucson and surrounding Pima County share one of the more progressive and effective outdoor lighting codes in the U.S., which helps to protect the observatory sites.
But there are things we would like to know that make for intersting research topics. Which kinds of light (public, private, illuminated signs, street lights, etc.) contribute most to skyglow over Tucson? How can these different sources be best managed in order to provide the light that city residents want without spoiling conditions for astronomy in southern Arizona? Which outdoor lighting policies and practices are most effective? My colleagues and I have undertaken some studies to try to answer these questions.
But there are things we would like to know that make for intersting research topics. Which kinds of light (public, private, illuminated signs, street lights, etc.) contribute most to skyglow over Tucson? How can these different sources be best managed in order to provide the light that city residents want without spoiling conditions for astronomy in southern Arizona? Which outdoor lighting policies and practices are most effective? My colleagues and I have undertaken some studies to try to answer these questions.
Tucson, Arizona, LED streetlight retrofit (2016-2017)
Street lighting has been traditionally thought to be a main contributor to skyglow over cities around the world in part because the number of streetlights is relatively high compared to other kinds of lighting in cities. The fraction of all city light emissions represented by street lights was believed to be around 50% before the arrival of light-emitting diode (LED) technology on the global outdoor lighting market in the late 2000s. While white LED is highly energy efficient compared to most earlier lighting technology, the color of this light is especially concerning for both astronomy and wildlife. Carefully managing the transition from legacy technologies to modern LED in cities is one of the great infrastructure challenges of our time as the world continues to convert to LED.
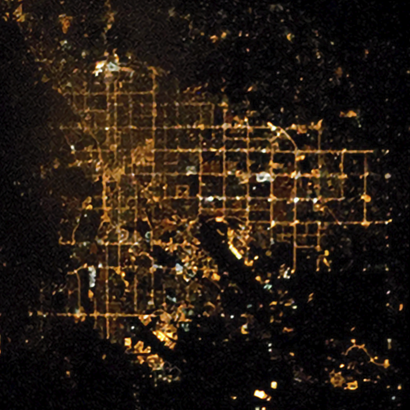
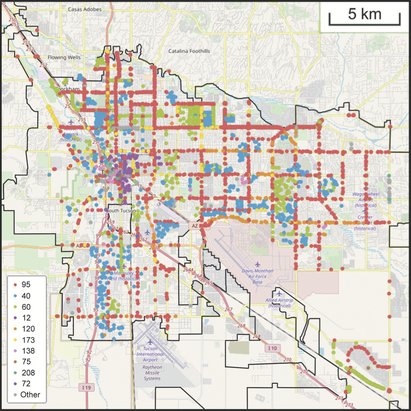
We recently had an opportunity to study such a conversion in Tucson. Over an 18-month period in 2016 and 2017, the City of Tucson converted nearly 20,000 municipally owned street lights from legacy high-pressure sodium (HPS) lights to white LED, a move that would save the City millions of dollars in energy costs over the lifetime of the streetlights. The image below of Tucson, taken by an astronaut aboard the International Space Station in 2012, shows the warm glow of sodium street lighting that predominated at the time. The map that follows shows the locations of street lights that were replaced in the modernization project.
We recently had an opportunity to study such a conversion in Tucson. Over an 18-month period in 2016 and 2017, the City of Tucson converted nearly 20,000 municipally owned street lights from legacy high-pressure sodium (HPS) lights to white LED, a move that would save the City millions of dollars in energy costs over the lifetime of the streetlights. The image below of Tucson, taken by an astronaut aboard the International Space Station in 2012, shows the warm glow of sodium street lighting that predominated at the time. The map that follows shows the locations of street lights that were replaced in the modernization project.
City officials aimed to achieve these savings without putting the night skies over neighboring observatories at risk, and they consulted with astronomers from early in the project. In addition, they opted for a networked control system for the street lights that enabled city engineers to take advantage of LED lighting characteristics, such as their dimmability.
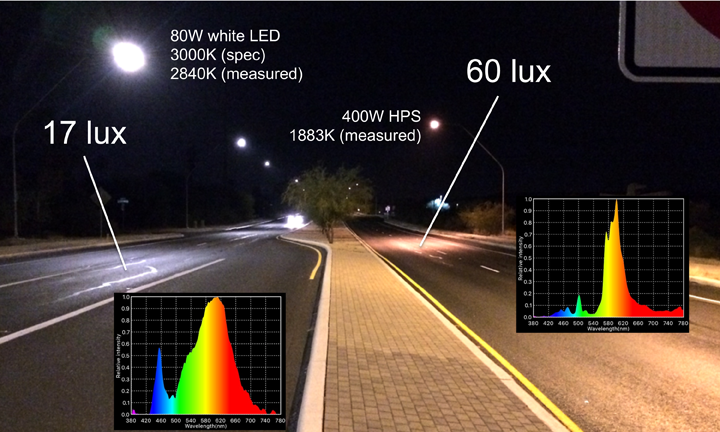
Tucson elected to significantly reduce the light emissions from its street lights as a consequence of the modernization project. While maintaining street lighting levels among recommended minimum values to ensure public safety, the City chose to lower the LED lighting levels by 63% compared to the brightness at which the legacy HPS street lights were previously operated. This is illustrated dramatically in the image below, taken in December 2016 during the lighting retrofit. It shows one of the main arterial streets in Tucson at night, with the new white LED lighting along the left side of the street and the old HPS lighting still in place along the right side of the street. The overlay indicates the light level reduction: 72%, or a factor of about 3.5.
Tucson elected to significantly reduce the light emissions from its street lights as a consequence of the modernization project. While maintaining street lighting levels among recommended minimum values to ensure public safety, the City chose to lower the LED lighting levels by 63% compared to the brightness at which the legacy HPS street lights were previously operated. This is illustrated dramatically in the image below, taken in December 2016 during the lighting retrofit. It shows one of the main arterial streets in Tucson at night, with the new white LED lighting along the left side of the street and the old HPS lighting still in place along the right side of the street. The overlay indicates the light level reduction: 72%, or a factor of about 3.5.
What we did
An opportunity presented itself in the Tucson LED street lighting project to study the effect of a very carefully considered lighting modernization effort on the night sky. We used measurements of the brightness of the night sky collected around the Tucson area in mid-2014 as part of an unrelated student project as a baseline for comparison with conditions after the retrofit was completed. In mid-2017, around the time project was about 95% complete, we repeated the 2014 measurements from the same locations using the same measurement equipment. We also collected before and after calibrated nighttime imagery of Tucson to measure the change in city light escaping the atmosphere, and we modeled the expected night sky brightness changes using radiative transfer software.
What we found
Our measurements suggested that the brightness of the night sky over Tucson was slightly lowered as a result of the street lighting modernization, even as the metro area population grew at an average annual rate of about 0.75% per year between 2014 and 2017. The effect was largest at distant observatory sites up to about 80 km away from Tucson, where changes in the brightness of the zenith of up to -20% were measured.
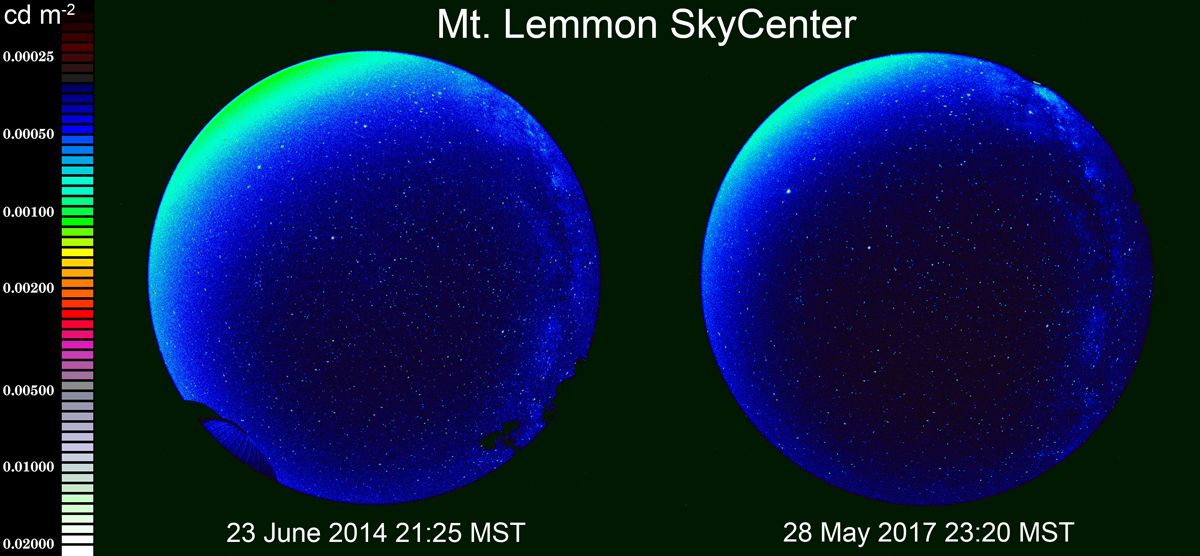
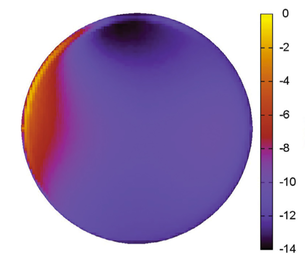
One particular location with a strong change between epochs was Mt. Lemmon, an observatory site north of Tucson. The image below compares all-sky views taken on early summer dates in 2014 and 2017, respectively, under similar atmospheric conditions. The light dome of Tucson is the swath of green along the horizon at upper left in each view, and it is clearly diminished in brightness in the 2017 observation as compared to 2014. The second image shows the result of one of our model runs for Mt. Lemmon. The false colors show the predicted percent change in all-sky luminance after the transition from legacy HPS to new white LED street lights in Tucson.
One particular location with a strong change between epochs was Mt. Lemmon, an observatory site north of Tucson. The image below compares all-sky views taken on early summer dates in 2014 and 2017, respectively, under similar atmospheric conditions. The light dome of Tucson is the swath of green along the horizon at upper left in each view, and it is clearly diminished in brightness in the 2017 observation as compared to 2014. The second image shows the result of one of our model runs for Mt. Lemmon. The false colors show the predicted percent change in all-sky luminance after the transition from legacy HPS to new white LED street lights in Tucson.
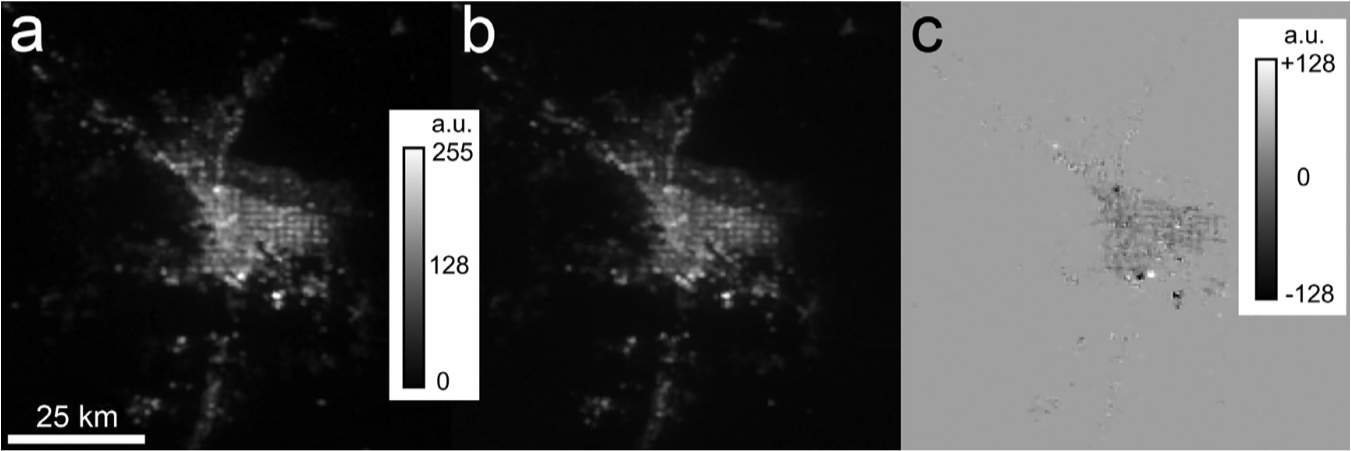
We also looked at whether the total light emission of Tucson as seen from space changed in the time of the retrofit. In the figure below, panels (a) and (b) show broadband nighttime images of Tucson and vicinity in June 2014 and June 2017, respectively. The scale bar shows gray levels in the 8-bit dynamic range of the versions as presented here. Panel (c) results from the subtraction of (a) from (b), showing the change in pixel intensity between the two epochs. The horizontal line in panel (a) is a 25-km scale indicator common to all three panels; the spatial resolution of each image is approximately 750 meters per pixel. We found that the upward-directed light emitted by Tucson detected from Earth orbit decreased by about 7%. These observed changes were consistent with expectations from our radiative transfer modeling.
We concluded that the street lighting modernization effort was a success, noting the decreases in both skyglow and urban light emissions seen from space consistent with our expectations. At the same time, we are unaware of any change in either rates of overnight crime in Tucson or the incidence of traffic accidents. We further conclude that lowering the roadway illuminance in the transition to LED did not compromise public safety.
Publication
"Skyglow Changes Over Tucson, Arizona, Resulting From A Municipal LED Street Lighting Conversion" Barentine et al. (2018). Journal of Quantitative Spectroscopy and Radiative Transfer, 212, 10. doi:10.1016/j.jqsrt.2018.02.038
"Skyglow Changes Over Tucson, Arizona, Resulting From A Municipal LED Street Lighting Conversion" Barentine et al. (2018). Journal of Quantitative Spectroscopy and Radiative Transfer, 212, 10. doi:10.1016/j.jqsrt.2018.02.038
Tucson streetlight dimming experiment (2019)
In the previous study, we used a limited (but fairly complete) inventory of light sources in a part of Tucson we took to be representative of the entire city and applied it to satellite remote sensing observations to estimate the fraction of Tucson's light emissions attributable to different kinds of lighting. Because public lighting was well accounted-for in our sample territory, we were able to derive a pretty robust estimate of the amount of Tucson's total lighting budget represented by street lighting: about 56%. We reasonably assumed that the corresponding fraction after the street lighting modernization was lower, because its diminished brightness was uncorrelated with other types of lighting in the city.
With the cooperation of the City of Tucson, we conducted a test of the lighting system by commanding all street lights away from 'conflict zones' (mainly, intersections) to certain dimming states during the overnight hours. On a series of nights in late March and early April, 2019, the lights were programmed to decrease in brightness from 90% of full power before midnight to as low as 30% of full power after midnight. On other nights, the power was raised from 90% to 100%. The result is noticeable to the eye. The two images below show the same stretch of arterial road lit at 90% and 30% of full power, respectively. The camera settings between the two configurations were identical.
With the cooperation of the City of Tucson, we conducted a test of the lighting system by commanding all street lights away from 'conflict zones' (mainly, intersections) to certain dimming states during the overnight hours. On a series of nights in late March and early April, 2019, the lights were programmed to decrease in brightness from 90% of full power before midnight to as low as 30% of full power after midnight. On other nights, the power was raised from 90% to 100%. The result is noticeable to the eye. The two images below show the same stretch of arterial road lit at 90% and 30% of full power, respectively. The camera settings between the two configurations were identical.
What we did
During the test nights we deployed a number of night sky brightness measurement devices across Tucson and even to some points beyond at radial distances from the city center of up to 50 km. We measured the zenith brightness before and after midnight on the test nights to look for the signal of an expected, sudden reduction in skyglow whose magnitude we expected to be a few percent based on radiative transfer modeling. We also looked at satellite remote sensing images of Tucson taken during the tests as another way of getting at the total light emission of the city. We aimed to determine from these measurements the fraction of total light emissions that could be directly attributed to street lights as opposed to all other sources. We hypothesized that by controlling the street lighting output in a controlled way, any changes in light seen either in the night sky or looking down from orbit would be attributable to those changes only on the presumption that other kinds of lighting in Tucson do not behave in any sort of coordinated fashion.
What we found
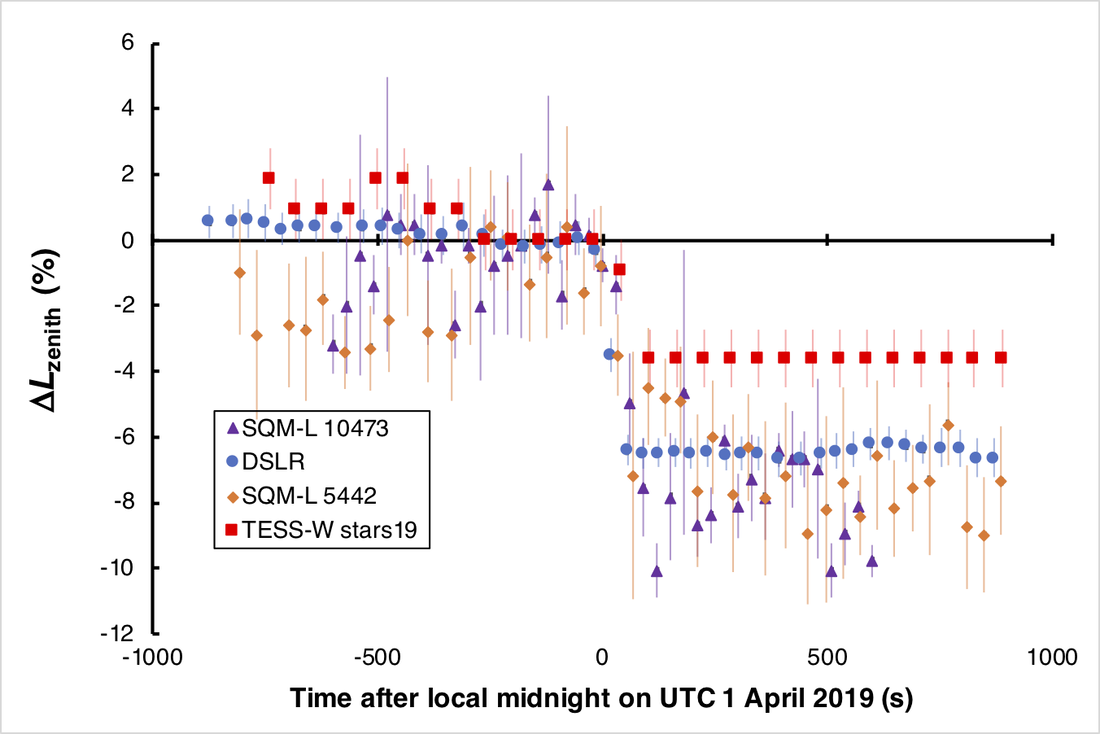
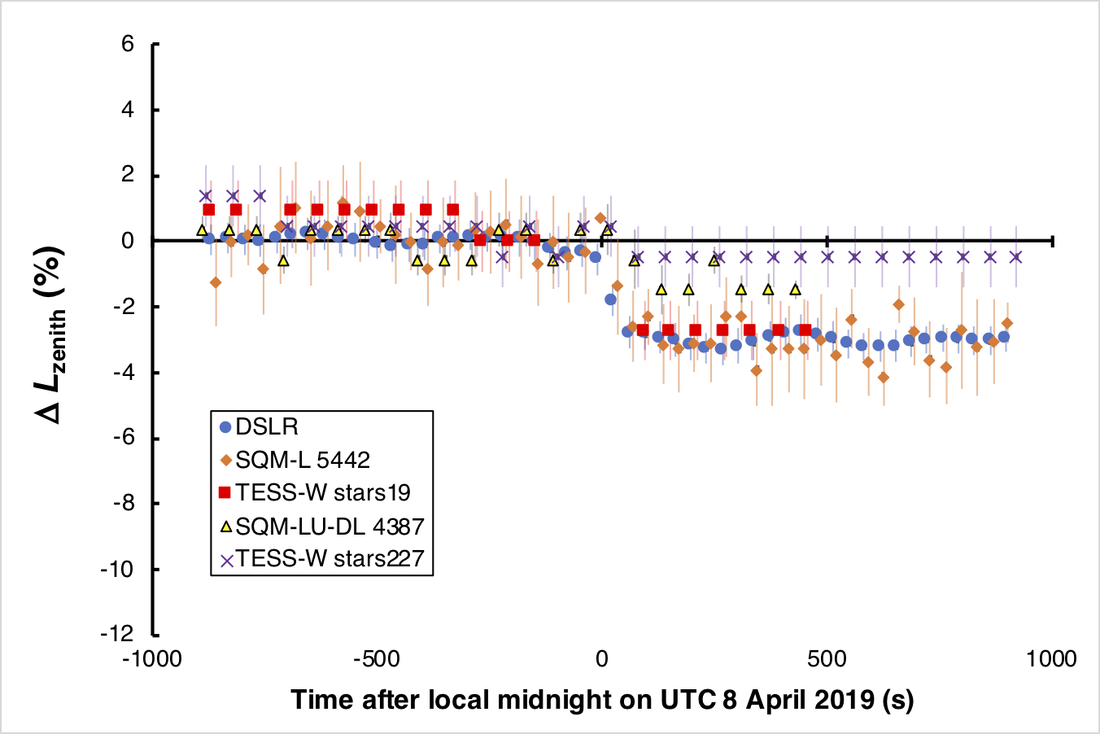
On the nights when street lighting dimmed from 90% of full power before midnight to 30% after midnight, we saw the zenith brightness decrease by up to about 5%. Interestingly, on the nights when the system was ramped up to 100% of full power at midnight, we still saw a net decrease in zenith brightness of about 2.5% across midnight. Examples of these two situations are shown below. In both plots, midnight occurs in the middle of the abscissa, and the ordinate shows the change in zenith luminance with respect to the average of values in the five minutes before midnight (i.e., immediately before the dimming took place). Notice that the points drop to negative percentages almost instantaneously at midnight in each case.
We think that uncoordinated nightly dimming of lighting other than street lighting — mainly private lighting from sources like residences and illuminated signs — at midnight on any given night offset the slight increase in light output from the street lighting system on the nights that the street lights were raised from 90% to 100% of full power at midnight. This can explain why the net change in zenith brightness at midnight was still negative even though all streetlights became slightly brighter during the test. It also makes the most sense if streetlights comprise a relatively small fraction of light emissions after the modernization project.
In consideration of all the uncertainties in the experiment, we conclude that street lighting in Tucson contributes about 14% of the skyglow seen at the zenith. Our radiative transfer model results imply that this fraction can be explained if the light emission of Tucson is composed of 26% known streetlights and 74% of other sources. The modernization of Tucson's street lighting system, and in particular the choice to reduce lighting levels during the retrofit, means that streetlights went from accounting for a little over half of the city's total light emissions to about one quarter.
In a separate paper led by my colleague Chris Kyba (GFZ German Research Centre for Geosciences, Germany), we tried to get at the same information by a different route, by analyzing satellite imagery. Chris found numbers for the street lighting fraction ranging from 13% to 21% depending on assumptions. We feel that the results of the two studies are broadly compatible, and that we successfully measured the same quantity using two rather different approaches.
Publications
"Recovering the city street lighting fraction from skyglow measurements in a large-scale municipal dimming experiment"
Barentine et al. (2020). Journal of Quantitative Spectroscopy and Radiative Transfer, 253, 107120. doi:10.1016/j.jqsrt.2020.107120
"Direct measurement of the contribution of street lighting to satellite observations of nighttime light emissions from urban areas" Kyba et al. (2020). Lighting Research and Technology. In press. doi:10.1177/1477153520958463
Media coverage
BBC, "Light pollution's wasted energy seen from space" (29 October 2020)
Phys.org, "Experiment uses smart city lighting to measure streetlight emissions" (29 October 2020)
Fast Company, "Surprise finding: Streetlights don’t cause much light pollution. Here’s what does" (30 October 2020)
Ongoing Tucson night sky brightness monitoring
I have been involved in measuring and monitoring the brightness of the night sky over Tucson since I relocated here in 2013.
Since mid-2017 I have operated a permanently installed night sky brightness monitor called 'stars19' on the east side of Tucson. The Telescope Encoder and Sky Sensor-Wifi (TESS-W) photometer is a project of the European STARS4ALL initiative and was developed by researchers at the Universidad Complutense de Madrid in Spain. The TESS-W instrument paper by Zamorano et al. is available here.
TESS-W is a small, environmentally durable photometer for measuring night sky brightness that requires only a location with a clear view of the zenith, access to utility electric power and a wireless network signal. Its light-sensing technology is the same as that of the popular Sky Quality Meter (SQM) device, but its spectral passband has enhanced red response to enable more accurate measurement of skyglow attributable to high-pressure sodium lighting. The plot below shows zenith sky brightness from my site in the last 24 hours; note that it only reports data when it is nighttime in Tucson.
TESS-W is a small, environmentally durable photometer for measuring night sky brightness that requires only a location with a clear view of the zenith, access to utility electric power and a wireless network signal. Its light-sensing technology is the same as that of the popular Sky Quality Meter (SQM) device, but its spectral passband has enhanced red response to enable more accurate measurement of skyglow attributable to high-pressure sodium lighting. The plot below shows zenith sky brightness from my site in the last 24 hours; note that it only reports data when it is nighttime in Tucson.
In addition to the brightness of the night sky, TESS is equipped with an upward-looking thermal infrared-sensitive diode that measures the 'temperature' of the night sky. The device can make an informed guess at whether the sky is clear or cloudy by comparing the sky 'temperature' to the actual temperature of the air. Since its installation, stars19 has captured and reported over two million zenith brightness measurements. The histogram below shows the distribution of values made on nights during which the weather was clear. Under such conditions, my zenith brightness is about three times brighter than a 'natural' night sky without skyglow.
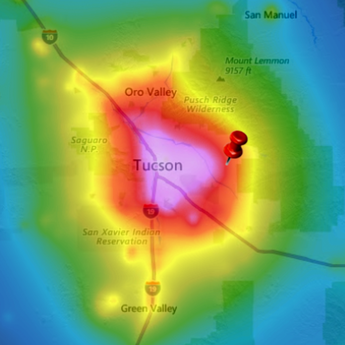
My site is at the edge of the greater Tucson conurbation, a metro area with a population of around one million inhabitants. The red pin on the map below shows my location in the context of Tucson and its skyglow, indicated by the false colors. These are predicted night sky brightnesses from the New World Atlas of Artificial Night Sky Brightness by Falchi et al. (2016) and mapped on lightpollutionmap.info. Colors correspond to increasing sky brightness from cool (blue, green) to warm (red, pink).
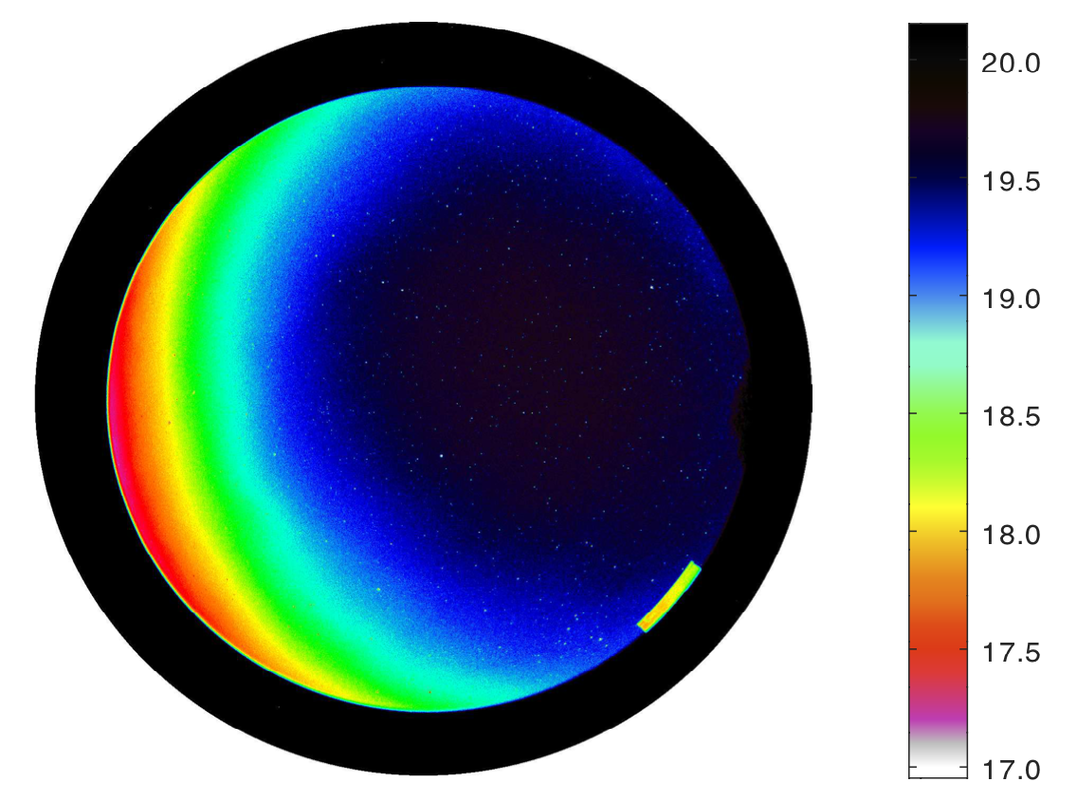
Most skyglow from my site is seen toward the general direction of the city center some 20 kilometers to the west-southwest. Consequently, the darkest part of the local night sky is in the opposite direction, toward the east and northeast. The image below shows a fisheye view of the night sky with the zenith at center and the horizon running 360 degrees around the edge. In this case, the false colors mean the measured brightness of the night sky in units of magnitudes per square arcsecond where again, cooler colors mean darker night skies and warmer colors mean brighter.
Most skyglow from my site is seen toward the general direction of the city center some 20 kilometers to the west-southwest. Consequently, the darkest part of the local night sky is in the opposite direction, toward the east and northeast. The image below shows a fisheye view of the night sky with the zenith at center and the horizon running 360 degrees around the edge. In this case, the false colors mean the measured brightness of the night sky in units of magnitudes per square arcsecond where again, cooler colors mean darker night skies and warmer colors mean brighter.
.
The air pollution/light pollution connection (2021)
Delhi, India, is one of the most air-polluted cities on Earth, and its residents can see few stars at night. Image by Kirk Kittell, licensed under CC BY-NC 2.0.
As described above, skyglow over cities is the result of many interactions between light rays leaving sources on the ground and molecules and small particles in the atmosphere. These interactions tend to either absorb light or redirect its path, which often results in redirecting the rays back down toward the ground. In those cases, observers on the ground see the light coming from the point of redirection in the atmosphere, giving the impression that the atmosphere itself is glowing. This artificial light competes with the light of the cosmos apparently "behind" it and makes it difficult to see the stars by lowering the contrast between them and the surrounding night sky.
Our understanding of how skyglow forms, then, suggests ways in which the composition of the atmosphere can influence how much skyglow is seen over a city. The concentration of molecules in the atmosphere doesn't change much from one place to another, except in instances where there are large differences in altitude. However, the amount of very fine particles in the air changes a lot from one city to another, and the main culprit is human activity: agriculture raises clouds of dust from the soil, while burning fossil fuels releases tiny soot particles into the air. Because such small particles are particularly good at scattering light at visible wavelengths, it stands to reason that dirty (i.e., polluted) air should scatter more light than clean air, and that places with poor air quality should also experience poor night sky quality because of increased skyglow.
My colleague, Prof. Miro Kocifaj of the Slovak Academy of Sciences and Comenius University in Slovakia, asked if I were interested in trying to figure out how significant this effect is. Prof. Kocifaj is a well-regarded expert on the radiative transfer of skyglow, and over the last 15 years he has published important papers on the subject (see here, here, here and here). One of the main products of his work is SkyGlow Simulator, a radiative transfer code with realistic physics that we used in the previous studies of skyglow over Tucson described above.
What we did
Building on Prof. Kocifaj's past modeling work, we came up with a new clear-sky model that accounts for scattering and absorption by aerosol particles and Rayleigh scattering by air molecules. The main variable in the model was the concentration of aerosols, whose properties we assumed from various literature measurements of urban particles. The model allows for up to fifth-order scattering; i.e., we follow light rays through up to five scattering events between light source and observer. Then we used the model to compute sky brightnesses at distances between source and observer ranging from 1 to 15 kilometers, which are typical spatial scales in many world cities.
We hypothesized that over such relatively small scales, whether the air was comparatively clean or dirty would have a lot to do with the amount of skyglow seen over cities and that the effect would be strongest nearest to the light sources. To check whether this was right required making measurements in conditions that involved a change in the density of aerosols over a city, which would simulate something like a persistent increase or decrease in air pollution. The passage of a weather front over Vienna, Austria, in spring 2019 offered an opportunity to measure the brightness of the night sky before and after the front temporarily cleared the usually polluted Viennese city air.
Our field test was carried out at the University of Vienna Institute for Astrophysics near the urban core of Vienna, Austria. Over the period of three days in early April 2019, the air over the city cleared significantly as the result of changing atmospheric conditions associated with a front that caused an abrupt reversal in the wind direction on Monday, 8th April. We measured the brightness of the night sky with a Sky Quality Meter atop the IFA building and monitored the changing aerosol density using the NASA Aerosol Robotic Network (AERONET) station in Vienna.
What we found
Our models clearly indicate a reduction of skyglow on various spatial scales as the density of aerosols decreases. The expected effect is strongest over the shortest distances; for example, a light source 1.3 kilometers from an observer that emits 10% of its light directly upward will see its contribution to the brightness of the night sky at the zenith decreased by about 60% in the transition between typically polluted city air to substantially cleaner conditions.
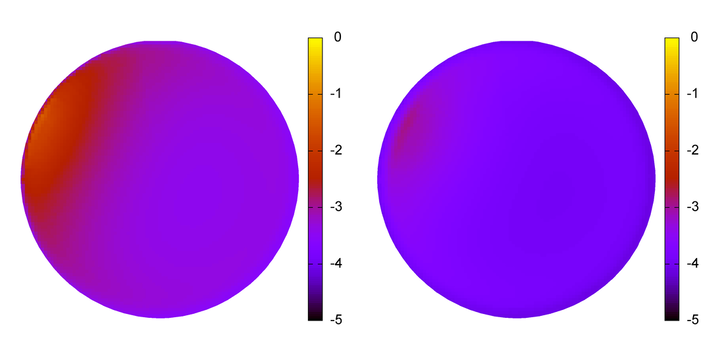
The figure below shows the brightness of the entire night sky seen at a distance of 1.3 kilometers from a light source northwest of the observer in polluted (left) and clean (right) air conditions. False colors represent the sky brightness, with warmer colors indicating brighter skies and cooler colors indicating darker skies. In both cases, the amount of light emitted by the source is the same; the only important difference between the two is whether the air is relatively dirty or clean.
The figure below shows the brightness of the entire night sky seen at a distance of 1.3 kilometers from a light source northwest of the observer in polluted (left) and clean (right) air conditions. False colors represent the sky brightness, with warmer colors indicating brighter skies and cooler colors indicating darker skies. In both cases, the amount of light emitted by the source is the same; the only important difference between the two is whether the air is relatively dirty or clean.
An effect we noted in the models is that, ironically, a trend toward cleaner air might make the night sky outside cities brighter, mainly because dirty air has the tendency to 'trap' light rays in and near cities, which accounts for the brighter night skies seen there. If the light rays can more freely escape the city environment due to fewer interactions with aerosols, they are more likely to travel some distance outside the city before scattering events in the atmosphere direct them back down to the ground where they are seen as skyglow. However, when those distances become large (tens to hundreds of kilometers), then the scattering and absorption of light by molecules becomes important. This is especially relevant for short wavelengths of light corresponding to colors like blue and green, while the effect is less for long wavelengths like orange and red.
The Vienna observations showed conditions there during the weather event in early April 2019 proceeded according to the predictions of our model. As the front passed over Vienna, the atmospheric optical depth — an indicator of the aerosol density overhead — in the middle of the visible spectrum rapidly declined from 0.4 on 6th April to 0.06 on 9th April. During the same time, the brightness of the night sky at IFA on the two dates decreased by about 57%. The models also allowed us to determine that most of the light in the night sky we measured at the zenith comes from sources on the ground within about 7 kilometers of the IFA campus.
We concluded that reductions in air pollution from any cause, whether due to short-term weather changes or persistent efforts to improve air quality, would result in the kinds of skyglow reductions indicated by our models and supported by our IFA observations. The result adds a further benefit to reducing air pollution beyond the well-known public health improvements seen to follow clearing of polluted air. But as a means of improving night skies over cities, we stress that air pollution reductions should not be relied on as an alternative to conventional light pollution reduction methods such as the modernization of outdoor lighting.
To reduce skyglow over cities, reducing air pollution should be seen as a tool that enhances rather than replaces techniques that we know work quite well. Using outdoor light at night wisely, including a diminished dependence on outdoor lighting through advances in lighting technology, remains the cornerstone of any effort to make meaningful improvements to urban night skies.
Publication
"Air pollution mitigation can reduce the brightness of the night sky in and near cities". Kocifaj and Barentine (2021). Nature Scientific Reports, 11:14622. doi:10.1038/s41598-021-94241-1.
"Air pollution mitigation can reduce the brightness of the night sky in and near cities". Kocifaj and Barentine (2021). Nature Scientific Reports, 11:14622. doi:10.1038/s41598-021-94241-1.
"Satellite light pollution" (2021)
Satellites and debris surround Earth. The cluttered circle is the geostationary orbit. (Image: NASA)
Until recently, skyglow research focused exclusively on two sources: natural light in the Earth's atmosphere, forming the backdrop against which skyglow is set, and artificial light on the ground that results in skyglow. But that changed in 2019 when the American private space company SpaceX launched the first group of satellites in its Starlink project. If fully deployed, Starlink will consist of over 40,000 satellites providing broadband Internet to virtually everywhere on Earth. According to public statements and media coverage, in total world space companies have proposed to deploy in excess of 400,000 new satellites in low-Earth orbit during the 2020s.
If these plans are realized, it would represent an increase in the number of functional objects in the orbital space near the Earth by a factor of 100 in only a decade. In addition to vastly more new satellites, this also means more discarded launch hardware left in orbit around our planet. Intentionally or otherwise, these objects can collide with each other, generating copious space debris. In turn, debris threatens other collisions in a runaway cascade expected to result in "Kessler syndrome", a condition in which near-Earth space becomes virtually unusable because of the high probability of damaging or fatal encounters.
Satellites and space debris orbit the Earth at altitudes where they may remain directly illuminated by the Sun as seen from the night side of the planet. There, they are seen as bright points of light moving across the night sky. When these points transit through parts of the sky under observation by telescopes, they leave bright streaks or trails in images that can obscure faint cosmic light beyond, potentially ruining science data. Astronomers held four conferences in 2020-21 to confront the problem and seek solutions. Since there is no reason to think large satellite constellations are going away anytime soon, they established a new clearinghouse to manage the ongoing work.
As we thought about all these new satellites being put into space, and the pieces of debris they will generate (collectively, "space objects"), we considered the effect of lots of objects too small to be resolved in telescopes as discrete points of light. Since they are still illuminated by the Sun, they reflect light to the ground. Some of that light will be seen directly in the night sky, possibly scattering in the atmosphere on the way down. For light detectors like human eyes, which are only moderately sensitive to faint light but see very large parts of the sky at once, an appropriate analogy is how we sense the Milky Way: stars too faint to be resolved as distinct points blue together to form the familiar glowing clouds of our home galaxy.
We set out to determine how much light this effect added to the night sky as a different kind of "skyglow". The result was the first to consider the overall impact of space objects on the night sky rather than the effect of individual satellites and space debris affecting astronomers’ images of the night sky.
What we did
We set out to answer the question: by how much is the diffuse brightness of the night sky elevated due to the reflection of sunlight from myriad, unresolved space objects?
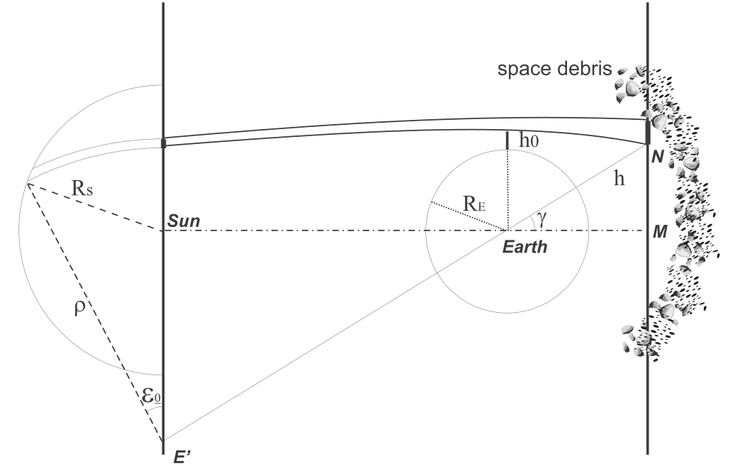
To figure it out, we modeled the space objects’ contribution to the overall brightness of the night sky, using as inputs to the model the known distributions of the sizes and brightnesses of the objects. We started with the geometry of the situation (below). The Sun directly illuminates some space objects in low orbits around the Earth, and indirectly illuminates others after refraction of sunlight through the planet's atmosphere. Objects are no longer illuminated when they pass fully into the shadow of the Earth.
To figure it out, we modeled the space objects’ contribution to the overall brightness of the night sky, using as inputs to the model the known distributions of the sizes and brightnesses of the objects. We started with the geometry of the situation (below). The Sun directly illuminates some space objects in low orbits around the Earth, and indirectly illuminates others after refraction of sunlight through the planet's atmosphere. Objects are no longer illuminated when they pass fully into the shadow of the Earth.
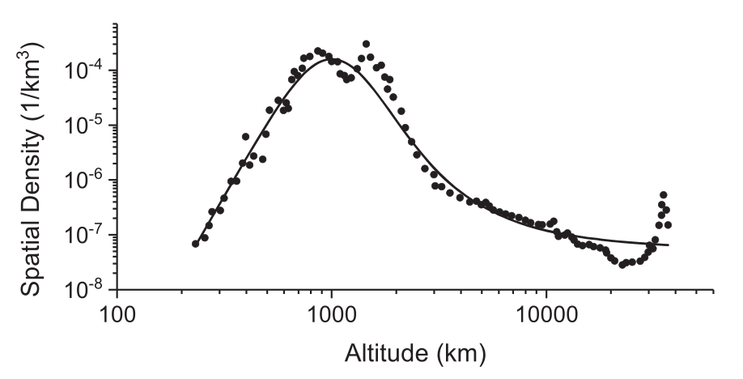
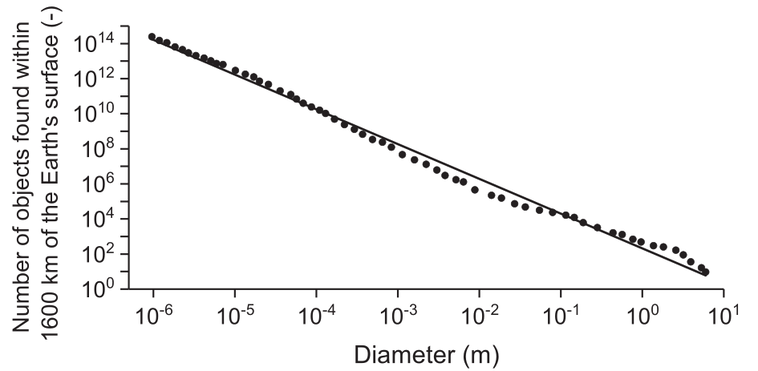
Using published sources, we estimated the density of objects orbiting the Earth both in terms of how many objects per unit volume there are at various altitudes and according to their sizes.
To keep the model calculations simple, we assumed each object was a smooth sphere known to reflect light in a particular way. To compute the brightness of the night sky from all these objects, we summed their individual contributions.
What we found
Our model inputs are highly uncertain, and some date to as long ago as the mid-1990s. We therefore projected those numbers ahead to 2019, just before the launch of the first Starlink satellites. The result adds about 21 microcandela per square meter of luminance to the night sky around sunrise and sunset. This is diffuse light in the night sky in addition to the brightness from both natural sources and ground-based light pollution.
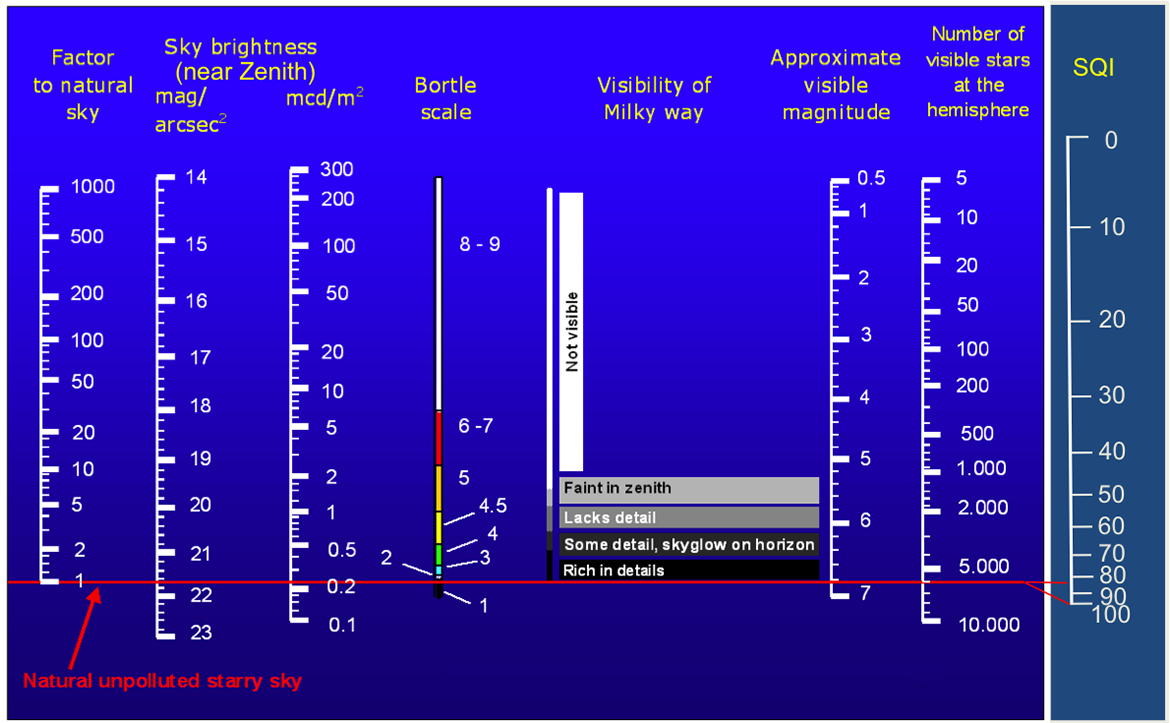
By coincidence, that number turns out to be about 10% of the light background in the night sky, which in turn is mostly the product of night airglow. That number is indicated by the red line in the nomogram below, on which any horizontal line drawn compares the same quantity across multiple scales.
By coincidence, that number turns out to be about 10% of the light background in the night sky, which in turn is mostly the product of night airglow. That number is indicated by the red line in the nomogram below, on which any horizontal line drawn compares the same quantity across multiple scales.
Night sky brightness nomogram courtesy of Henk Spoelstra, used with permission.
10% artificial light above the natural background is, also coincidentally, a critical level mentioned in a 1979 resolution by the International Astronomical Union as the limiting acceptable value of light pollution at astronomical observatory sites.
Our results imply a further brightening of the night sky proportional to the number of new satellites launched and their optical characteristics on orbit. If the rate of increase in the number of space objects from the 1990s to 2019 held steady into the future, by 2030 the amount of "satellite skyglow" would reach as high as 32 microcandela per square meter. Our model did not take into account the likely actual rate at which space objects will increase, which could be much higher than in recent history. A worst-case scenario has the satellite contribution roughly equalling the natural background by the end of the decade.
Satellite operators like SpaceX have recently worked to lower the brightness of their spacecraft through design changes. Despite these mitigating efforts, the collective effect of a sharp increase in orbiting objects stands to change the experience of the night sky for many. By the end of this decade, the results may become obvious to the unaided human eye from a dark-sky site.
Future directions
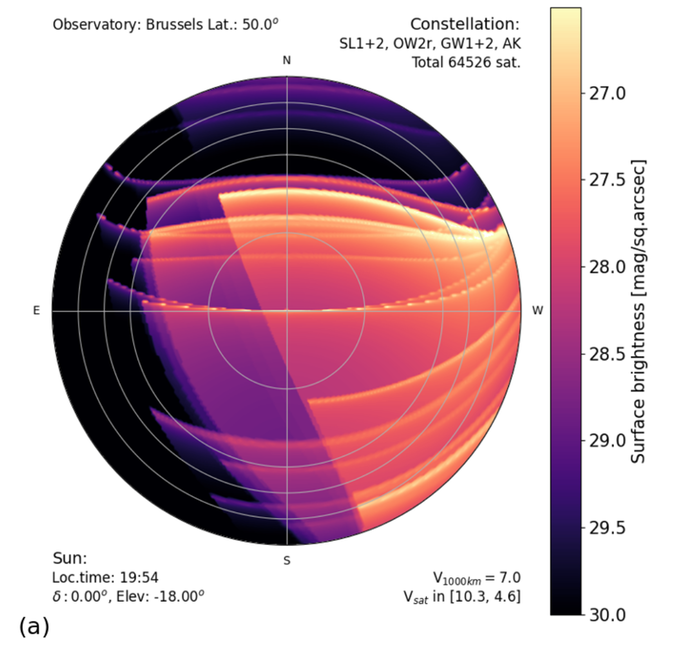
Other groups have become interested in this topic and are also trying to model the effect. For instance, Cees Bassa (ASTRON Netherlands Institute for Radio Astronomy), Oli Hainaut (European Southern Observatory) and David Galadí-Enríquez (Calar Alto Observatory) published their own satellite sky brightness models in early 2022. Whereas we assumed a uniform distribution of space objects, they accounted for the orbits of various satellite constellations proposed for launch by 2030, finding that the brightness of the night sky that would result by that time is dependent on the direction in which one looks. Below is their Figure 11a, showing a prediction of a 1% increase in sky brightness at most in parts of the sky where satellites mostly tend to dwell.
They conclude that this is unlikely to be a problem for astronomy "provided they are not ground into microscopic debris." Their bottom-line message is that avoiding collisions is crucial to holding the line on night sky brightness from space objects.
However, there is reason to believe that this condition — mostly intact satellites — will not hold. If runaway debris generation that some fear becomes reality, given what we know about the distribution of object sizes resulting from space collisions, there could be vastly more small (~millimeter-sized) objects in orbit around the Earth by 2030 than there are now. Beyond the obvious risk posed to spaceflight, such an outcome risks quickly accelerating the degradation of the night sky due to human activity.
It is worth continuing to refine these models, adding increasingly realistic number, size and spatial distributions as inputs. While the "shells" of brightness predicted by Bassa, Hainaut and Galadí-Enríquez may in fact come to pass, debris tends to spread out in orbital space and may eventually reach a more or less spatially uniform distribution. We expect that will raise the brightness of the night sky in all directions.
We are also giving some thought to how we might observationally test models that, right now, predict night sky brightness enhancements a factor of about four below the threshold of the night airglow. An ideal location to try to sense this diffuse light directly is above the airglow-forming layers, at altitudes of 100-300 kilometers, but below the majority of objects in low-Earth orbit. The International Space Station, orbiting at about 400 kilometers, is one possible platform for such observations.
Publication
"The proliferation of space objects is a rapidly increasing source of artificial night sky brightness". Kocifaj, Kundracik, Barentine and Bará (2021). Monthly Notices of the Royal Astronomical Society: Letters, 504(1), L40-L44. doi:10.1093/mnrasl/slab030.
"The proliferation of space objects is a rapidly increasing source of artificial night sky brightness". Kocifaj, Kundracik, Barentine and Bará (2021). Monthly Notices of the Royal Astronomical Society: Letters, 504(1), L40-L44. doi:10.1093/mnrasl/slab030.
